Corporate Bond Fund Q1 2020 Update
Backdrop
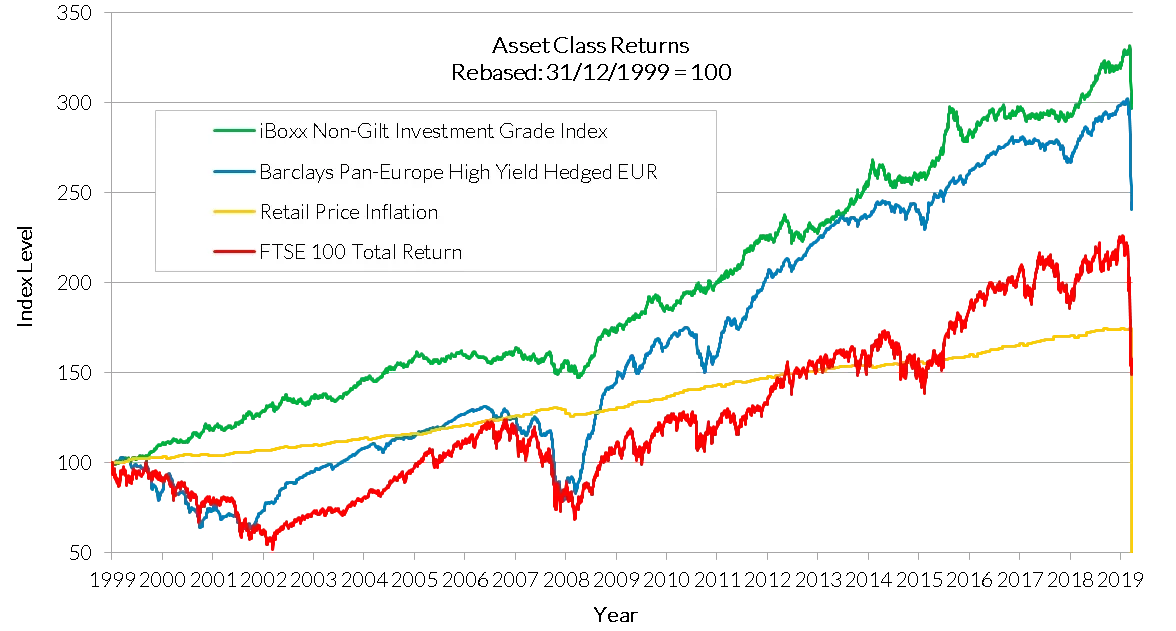
Q1 2020, or more specifically March 2020, will go down in history as a game changer. Correlations that bond investors normally take for granted broke down. Trading ranges that had been long established over decades, through good times and bad, were shattered. Just as the fear of a high mortality rate for this new coronavirus swept through the human population, so a real fear of capital wipe-out descended over markets, leading to a dash for cash that left no asset class untouched.
Amid the worst quarter for stock markets since 1987, CBF was down -5.04% in March, the worst single month in the fund’s history (October 2016 was the previous worst at -2.16%). The peak to trough drawdown, from March 6 to March 19, was -9.20%. These returns, while bad in and of themselves, should be seen in context against far worse reference benchmark returns of -7.52% for the month and -13.10% for the peak to trough drawdown, and worse sector returns of -6.42% for the month and -11.25% for the peak to trough drawdown. CBF’s underweight risk position therefore led to outperformance of +248bp for the full month versus the iBoxx benchmark (+138bp vs. the sector), with +390bp of outperformance in terms of peak to trough drawdown again versus the benchmark (+205bp vs. the sector). Given in a normal year we run the portfolio with the goal of outperforming the index for the full year by approximately +100bp, to achieve +248bp in one month is exceptional. For the Q1/YTD period, the fund returned -3.10% vs the index -5.62%, outperformance of +252bp (+128bp vs. the sector). CBF was top quartile versus its performance benchmark the IA GBP Corporate Bond Sector in both March and Q1. The pace of the drawdown across all markets was unlike anything any of us at TwentyFour had ever experienced in our careers, many of which go back to the 1980s. This led to my blog post showing that during the last two crises this century, credit led equities in the recovery by several years; because coupons are contractual and dividends are discretionary, so the rewards to fixed income holders should come back quicker in the cycle. This time around we are even more convinced this will be the case, since we expect government support for companies to contain either implicit or explicit restrictions on dividends and share buybacks. And even when banks have been advised by regulators to stop bonus payments to keep capital ratios high, they have not asked for deferrable coupons on their most junior bonds to be suspended, another very supportive argument for the credit versus equity story.
Chart 1: FTSE 100 VS UK IG and European HY, daily returns from 31/12/1999 to 23/03/2020
Fund Performance
Firstly, the month’s losses of -5.04% and the peak to trough drawdown of -9.20% are unlike anything ever experienced by the fund before. However, in a broader context versus peers, this is actually strong outperformance, top quartile in fact. Many of the other corporate bond funds we normally compare ourselves to were down by double digit figures, more than 17.6% in the case of one fund.
Chart 2a: Q1 2020 CBF returns vs top performing peers
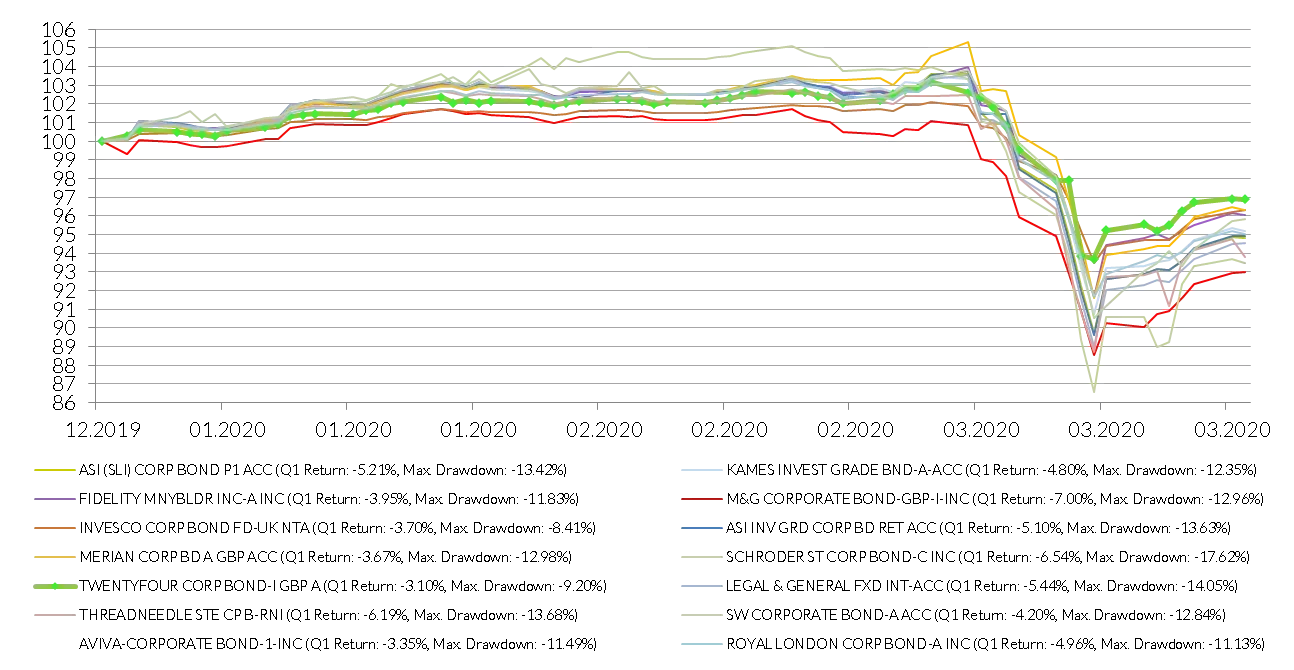
Source: TwentyFour underlying data Bloomberg
On top of this outperformance of peers in the bear market we have just witnessed (top performing fund in Q1 for the peer group above), the fund had been the second best performer from inception versus peers prior to this in total return terms, and first in risk-adjusted terms.
Chart 2b: Since inception returns vs top performing peers, to March 31 2020
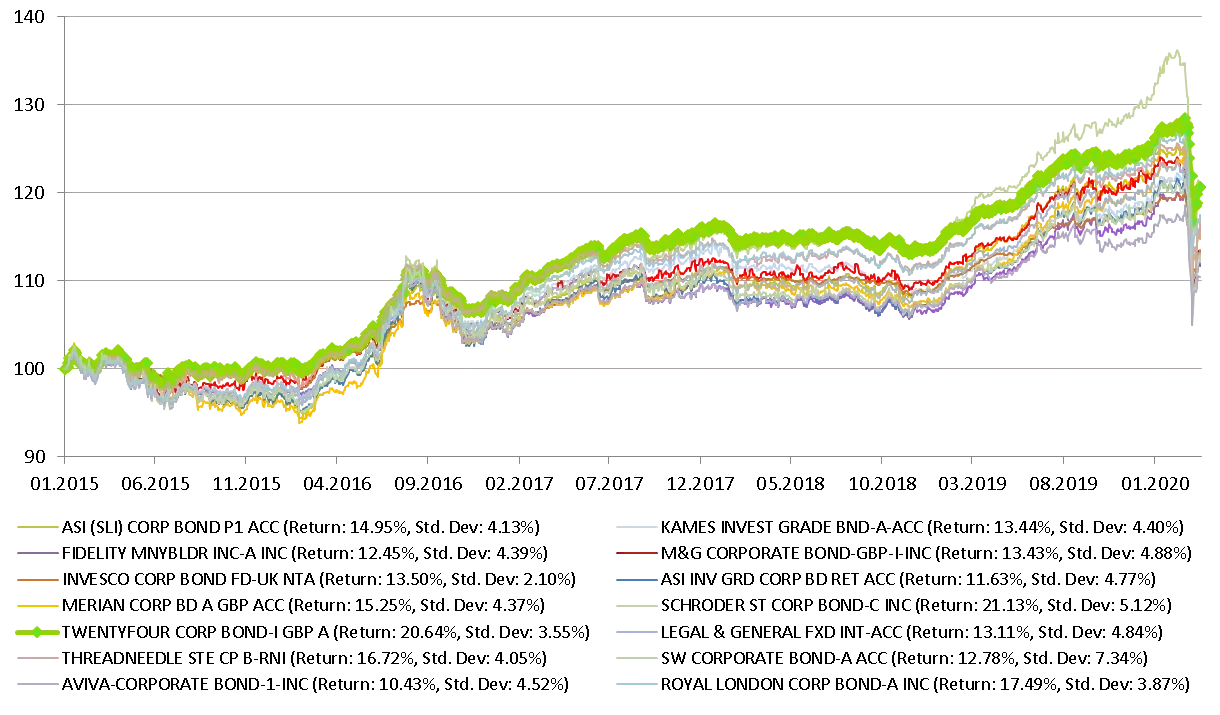
Source: TwentyFour underlying data Bloomberg
Chart 3: Since inception risk-adjusted returns vs peers, to March 31 2020
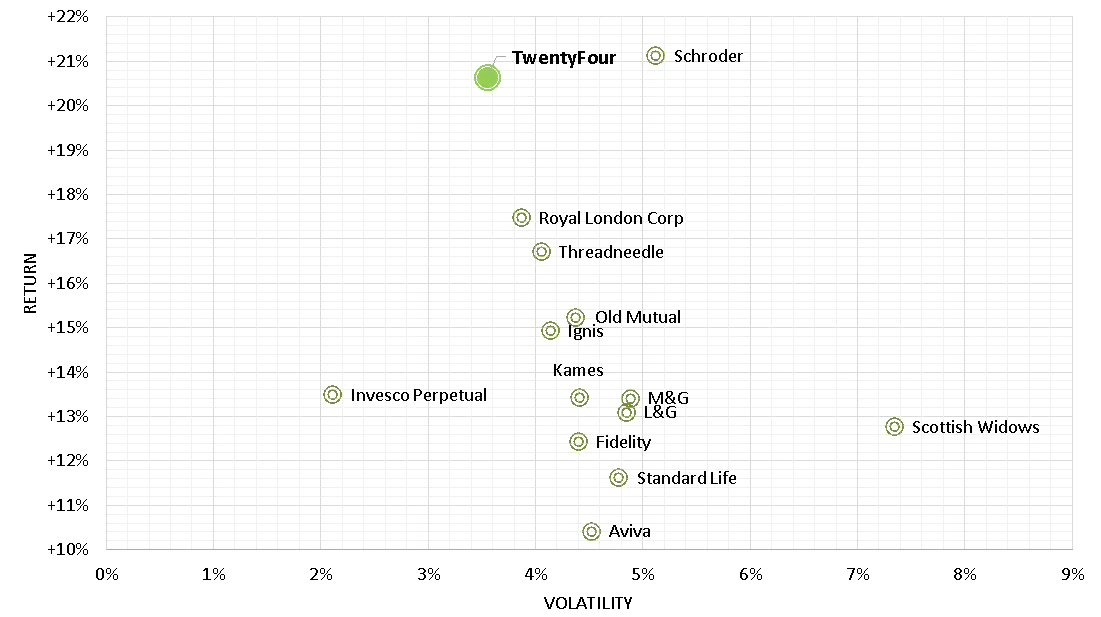
Source: TwentyFour underlying data Bloomberg
What has led to this outperformance? In my view it is three simple things:
1. Our process is built on trying to deliver the best possible risk-adjusted returns. Our starting point on any investment is to consider not
just the previous return, but the return divided by the volatility – this is the essence of our stock picking approach, and why we lean so heavily
on our proprietary database Observatory.
2. We had positioned the fund at its lowest level of aggregate risk in its history. As yields had fallen consistently through 2019, we steadily
de-risked the fund, first moving almost completely out of HY (from a 12% weighting to BBs down to 2%, nothing lower rated than BB), and
secondly taking the beta of the fund down to just 0.6, from 1.2. That is the lowest beta we have ever had in the portfolio, or in my career
in fact.
3. No swing pricing, no bid pricing, no dilution levy. We have stuck rigorously to mid pricing at the security and fund level, across all funds
at TwentyFour, to make good on the commitments we have made to our investors – that they should always be able to take their capital out
without penalty. Some other funds have either moved to bid pricing or applied dilution levies, negatively impacting performance.
Attribution
Given the crazy market conditions in March, it is perhaps surprising that there was a single part of the portfolio that produced a positive return. That was our government bond portion, which eked out a decent +0.44% return. Given government bonds are not in the benchmark, this off-benchmark position (which would normally hold the yield of the portfolio back), paid back that lack of yield with helping towards capital protection in the worst month we have ever seen.
Everything else was negative in absolute terms, though you can see that for the bulk of our sector exposures shown in Chart 4, we outperformed the reference benchmark, showing that our stock selection paid significant dividends in March. Even in the Consumer Cyclical sector, where our exposure to SAGA and Centre Parcs dragged our average sector return lower than the benchmark as you can see on the contribution version of the chart (Chart 5), because we were so underweight that sector, we still outperformed the benchmark.
Chart 4: CBF sector returns versus iBoxx for March 2020
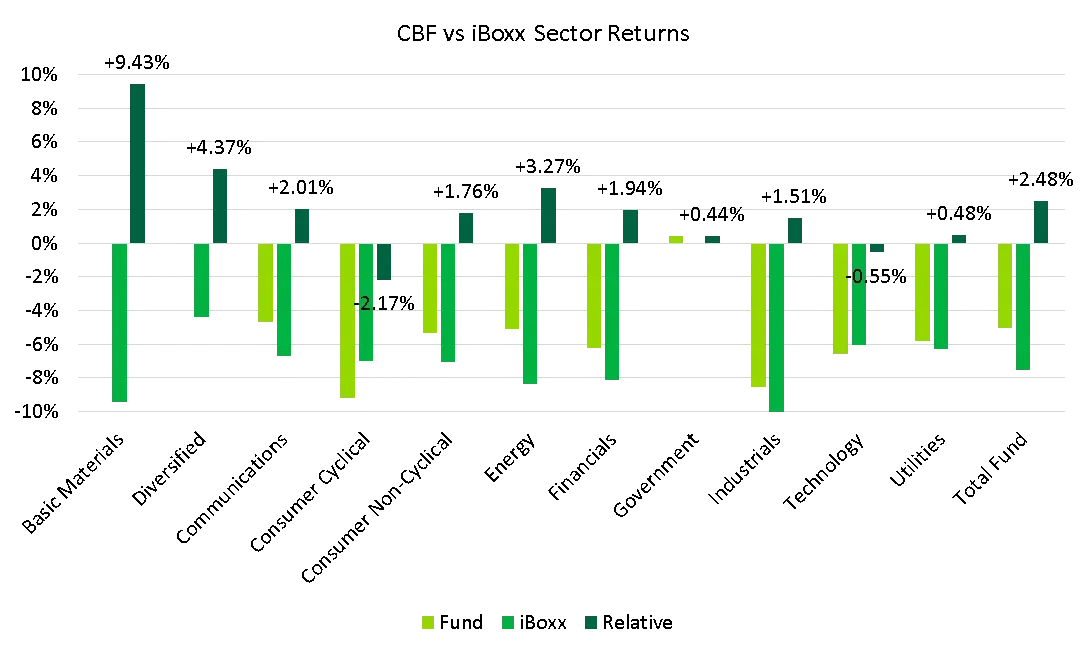
Having zero exposure to the Basic Materials sector was significant in absolute terms as Chart 4 shows, given the sector was down nearly 10%, but in truth it is such a small part of the benchmark you can see the contribution was actually very small at +13bp.
The outperformance of +327bp within Energy was helped by two factors: firstly, that we had hardly any exposure directly to Oil (just a fiveyear, AA rated Total bond), preferring gas and electricity distributors rather than Oil E&P, and secondly that we had shorter dated hybrid bonds, rather than long dated, single-A rated senior bonds, with large spread duration but not much spread. Likewise with our Utilities exposures.
It was a similar theme in Financials, of preferring short dated subordinated banks and insurers with attractive break-evens, over longer dated senior financials with spread duration but little spread that also led to +194bp of outperformance.
Chart 5: CBF sector return contribution versus iBoxx for March 2020
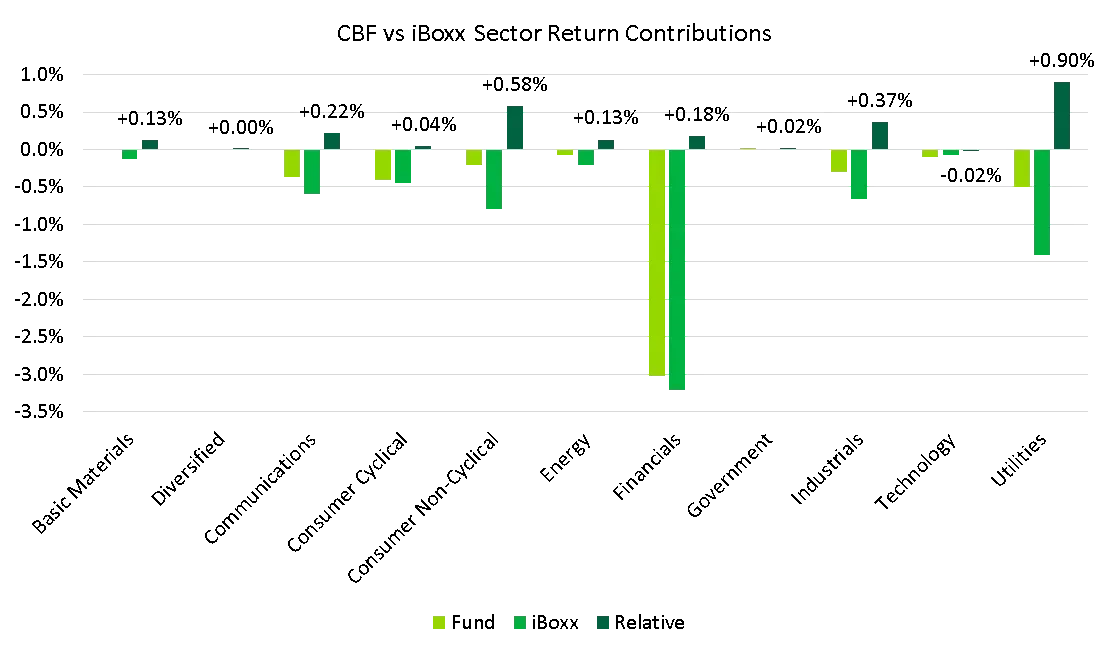
Source: Bloomberg PORT, iBoxx
Looking in more detail at contributions, our underweights in long dated (often single-A rated) Utilities, Consumer Non-Cyclical, Industrials and Basic Materials delivered significant alpha, while despite strong outperformance within Financials, our overweight to the sector meant more modest alpha of +18bp there.
The only negative here was Technology (a sector we hardly normally invest in), where we lost 2bp relative.
In terms of individual stock moves or news that concerned us during the month, there were two:
Centre Parcs, which was down an average of -10.5% across the two positions we have, comprising 1.75% of the portfolio as of the end of Q1. As a holiday property company this is a name with obvious concerns, but we had an update call with Centre Parcs and its private equity sponsor has reiterated its capital support to the group. As such we have no specific concerns on this name in comparison to any other non-financial exposure we have. The Consumer Cyclical sector that this company is in was down -7.02% for the month.
SAGA was the second concern, and is more concerning to us than Centre Parcs. The May 2024 SAGA bond held in the portfolio was down nearly 27% for the month, with a cash price hitting 45 at one point. Putting that in context, the average recovery rate for non-financial IG credit over the last 100 years has been around 40; this bond was trading like it had defaulted already. We think this is wildly overdone. Yes SAGA has issues – roughly 50% of its revenues come from its cruise operations, which are suspended to at least May (and of course the cruise sector has been one of the worst hit by COVID-19). But the other 50% comes from insurance, mostly vehicle insurance, where the prognosis is much better. Is government support possible, or even likely? We would say yes for travel providers (bus and train companies especially), and some form of assistance is very likely for SAGA, but don’t forget that the insurance revenues will likely hold up well, and we think vehicle insurers may do relatively well given fewer vehicles on the roads but with premiums still being paid. As such, we think the fair value for this bond should be closer to 70, and with a position size of 0.4%, we are not minded to sell at this point.
Downgrades/Defaults/Fallen Angels
Given our continued focus on BBBs, with a strong preference for BBBs with less than five years to maturity, a natural question then is what happens to the fund if we see a wave of downgrades, and possibly even defaults?
Firstly, we certainly expect a raft of downgrades across swathes of fixed income: HY, IG and even government bonds we expect to suffer ratings downgrades over time as real economic risks translate into lower revenues for corporates, and additional borrowing for governments. No sector will be immune.
But we do not expect an Armageddon scenario either, and certainly do not expect defaults to eclipse anything we have seen in the last 100 years, such as 1938 for example.
The first thing to do is look at fixed income in context. Looking at 100 years of default data, we can see that while HY has been a) volatile and b) very cyclical, by contrast the default characteristics of IG and even BBBs (the lowest rating band in IG) have been dramatically lower, and we don’t expect this to change going forward. In fact, IG and BBB defaults almost appear as a rounding error on the below chart. In the post-war era, the peak level of BBB defaults was in 2008, where it hit 1.08%. In 1938, the all-time high for BBB defaults, it was 2%.
Chart 6: Annual issuer weighted default rates, 1920-2017
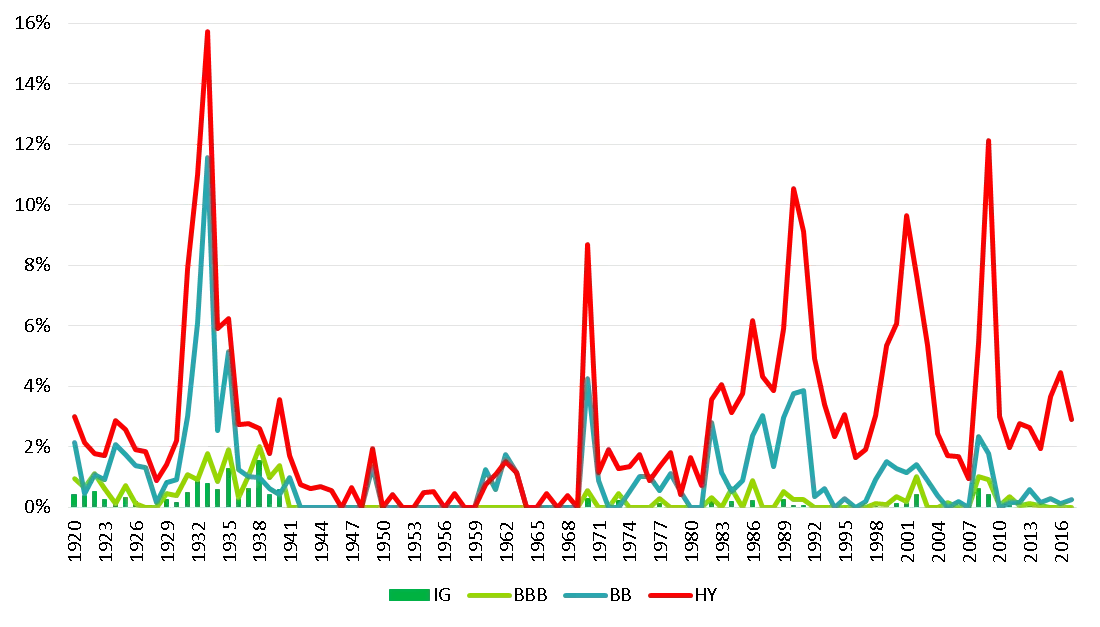
Source: Moody's Default Study 2017, TwentyFour
Of course, we cannot be complacent, as BBBs can and do transition to BB or even B, and can then default from there. However, the huge extent of the government support in response to COVID-19 in our view mitigates these risks, at least for sensibly run companies with what we would regard as acceptable levels of leverage.
We actually see a greater potential negative capital impact from single-A rated bonds being downgraded to BBB – this is because many of these bonds have a huge amount of spread duration, so a little bit of spread widening costs a lot of capital, and they simply do not have enough spread or yield to cushion against these losses. Will they ultimately default? Extremely unlikely in our view – but mark-to-market losses could be large.
Where defaults are more likely is for more levered companies in HY, with high operational leverage, or more questionable asset quality. Here our outlook is materially different. We expect to see a significant increase in HY energy, travel, and leisure defaults, for example. However, these are not the sorts of investments that are made in CBF. Remember CBF sticks to predominantly IG bonds (the portfolio is 98% IG today), staying in developed markets (not emerging markets), with a preference for shorter dated exposures in higher beta sectors, such as financials and non-financials with strong balance sheets. Speculative risks are not a part of CBF’s toolkit, nor the investment process for TwentyFour’s Outcome Driven team in fact.
The real value of credit ratings to us is in their relative, rather than absolute, sense. A wave of downgrades across many sectors does not increase their relative importance, nor does it generate a signalling mechanism. In fact, the bulk of the credit market already appears to be trading as if these bonds have been downgraded into HY. Where ratings will be most important is far later in the cycle, as the winners and losers within the deeper parts of HY are brought to the surface. But for now, with HY credit default swap (CDS) spreads implying a default rate of more than 50%, the risk-reward balance in credit looks compelling to us.
Outlook
The yield on the fund today is above 3.5%. At the end of February 2020 it was just above 2%. Furthermore, this dramatic increase in yield has come without adding any additional risk. Adding on the potential for yield curve roll-down, and the increased opportunity for alpha that volatility brings with increased dispersion between sectors and individual bonds, I think total returns from the portfolio could exceed 5% on a 12-month forward view, without adding significant risk, but that could change as the outbreak progresses.
At the point at which we do want to add risk to the portfolio (we expect our preference would be to selectively add BB-rated Coco bonds from our favoured building societies of Nationwide and Coventry, for example, ideally at yields above 10%). We estimate that in doing so based on our current analysis the fund yield could exceed 4.5%. In that scenario, we think returns similar to those generated in 2016 and 2017 could be repeated, i.e. high single digit returns with a volatility below 4%. This however is not guaranteed and is an estimate based on the opportunities we’re seeing right now.
As mentioned at the beginning of this piece, the broader narrative for us is one in which we believe credit will significantly outperform equities for a number of years, firstly because this has been the case in both of the other significant distress periods this century, but secondly because rewards to shareholders from dividends and buybacks are likely to be significantly curtailed. These are discretionary payments, after all, while coupons in the sorts of bonds we hold in CBF are not.
And because the large government aid programs will likely need many years of increased government bond issuance, the outlook for sovereigns looks challenging to say the least – again suggestive of credit outperformance over the longer term. On the face of it, we expect steeper government yield curves due to the twin pressures of increased government bond issuance and the prospect of modestly higher inflation that increased fiscal loosening may bring. This is likely to lead to government bond yields higher than we see today – but this will be no straight line move, and more than ever, we expect the risk-off hedges in government bonds will be a key part of CBF’s toolkit to help protect capital and provide some welcome lower correlations to risk.
What we cannot predict is the ultimate depth of the recession that we will witness globally, or how long that recession will last. The policy response so far has been impressive, and will likely lead to a strong rebound that we hope could emerge in Q3, but of course the timing of the recovery depends on when lockdowns stop.
Ultimately this means we think markets are likely to exhibit further volatility for some time yet. However, the valuations in some parts of credit are now so attractive that in our view investors are being well compensated for future risks (even risks like substantial downgrades deep into HY). By focusing on higher conviction, short and medium dated IG, and keeping positions restricted to our best ideas only (that is why we limit portfolio line items to a maximum of around 100 bonds), we believe we can continue to generate some of the best risk-adjusted returns in the corporate bond sector, while keeping capital preserved to a greater degree than others in periods of volatility.
Regards,
Chris and the Outcome Driven Team
Performance
TwentyFour Corporate Bond Fund Performance
| Rolling performance | 03.19-02.20 | 03.18-03.19 | 03.17-03.18 | 03.16-03.17 | 03.15-03.16 |
| GBP I Acc Class | 2.31% | 2.62% | 3.46% | 9.11% | 0.49% |
Past performance is not a reliable indicator of future performance. Performance figures are shown in GBP on a mid-to-mid basis inclusive of net reinvested income and net of all fund expenses. Performance data does not take into account any commissions and costs charged when shares of the fund are issued and redeemed. The value of an investment and the income from it can fall as well as rise as a result of market and currency fluctuations and you may not get back the amount originally invested. *Inception date of TwentyFour Corporate Bond Fund: 15 January, 2015.
Source: TwentyFour; 31 March, 2020
About the author

About the author
